Why Your Fomo Profile Chart Changes After You Sell or Withdraw
Fomo's profile chart adds cash, holdings and perps equity, so a $100 withdrawal drops it by $100 without being a loss. Learn to read real performance.

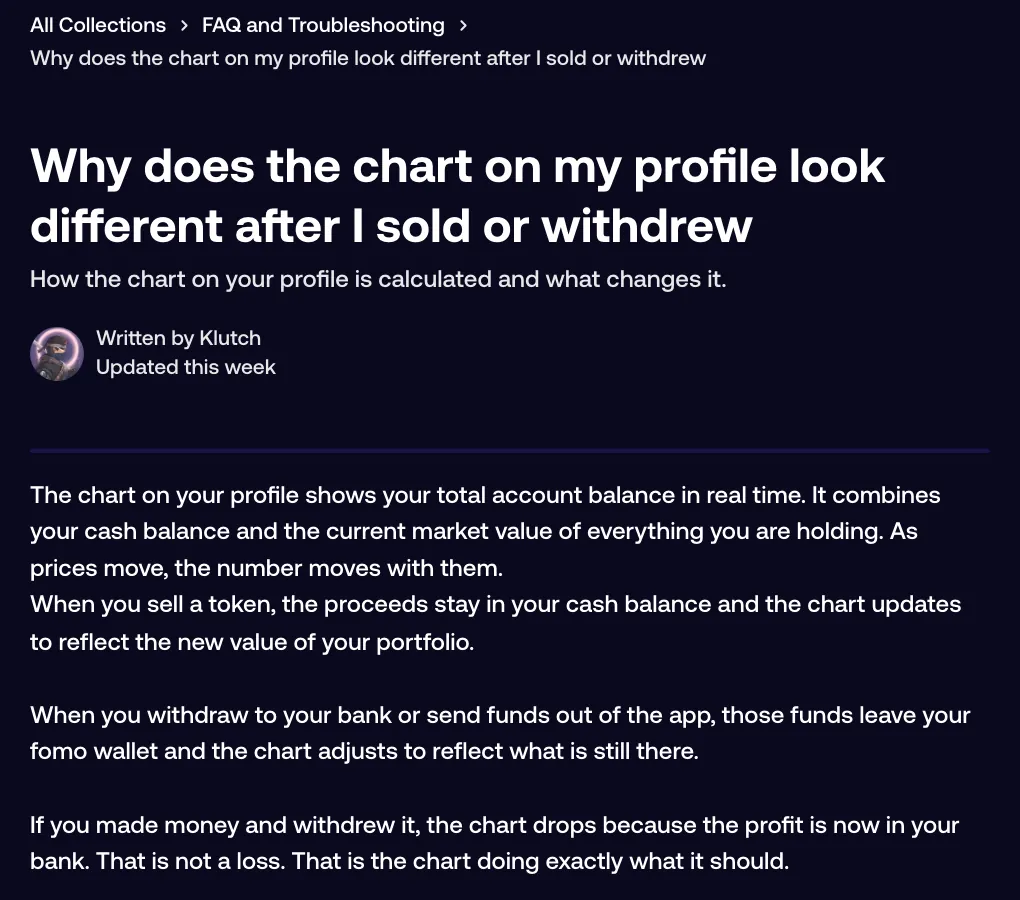
The chart on your Fomo profile shows your total account value: your cash balance, everything you hold at today's market price, and your perps account equity. When you withdraw or send money out, it leaves your wallet and the chart drops to match what is still there. That drop isn't a trading loss. A sell barely moves the chart, because the proceeds stay in your cash balance.
Your trading result is the PnL figure under the balance, which doesn't count money going in or out. Here's how the two behave, and how to work out how you are really doing.
What the chart tracks
Think of the chart as a running total of the whole account. Cash, tokens at current prices and perps equity are added together only in that number and in the graph. As prices move, the line moves with them. Money arriving pushes it up and money leaving pulls it down.
The chart doesn't know why money moved. A $1,000 withdrawal to your bank and a $1,000 trading loss draw the same drop.
What happens when you sell
Selling swaps a token for USDC in your cash balance. The total stays about the same, minus fees and any slippage, so the line hardly changes at the moment you sell.
The difference shows up later. Cash doesn't move with a token's price, so once you have sold, that part of your account goes flat. If the token keeps climbing after your sell, the chart no longer climbs with it.
What happens when you withdraw or send
A withdrawal to your bank, a transfer to an outside wallet or exchange, and a Send to another Fomo user all take money out of your Fomo wallet. The chart adjusts to what's left. If you made money and cashed it out, the line drops because the profit now sits in your bank. Fomo's help center calls that the chart doing exactly what it should.
Moving cash into your perps account is different. Perps account equity is part of the total, so that move shouldn't pull the chart down.
The same logic runs in reverse. Deposits and incoming sends push the line up without a single trade.
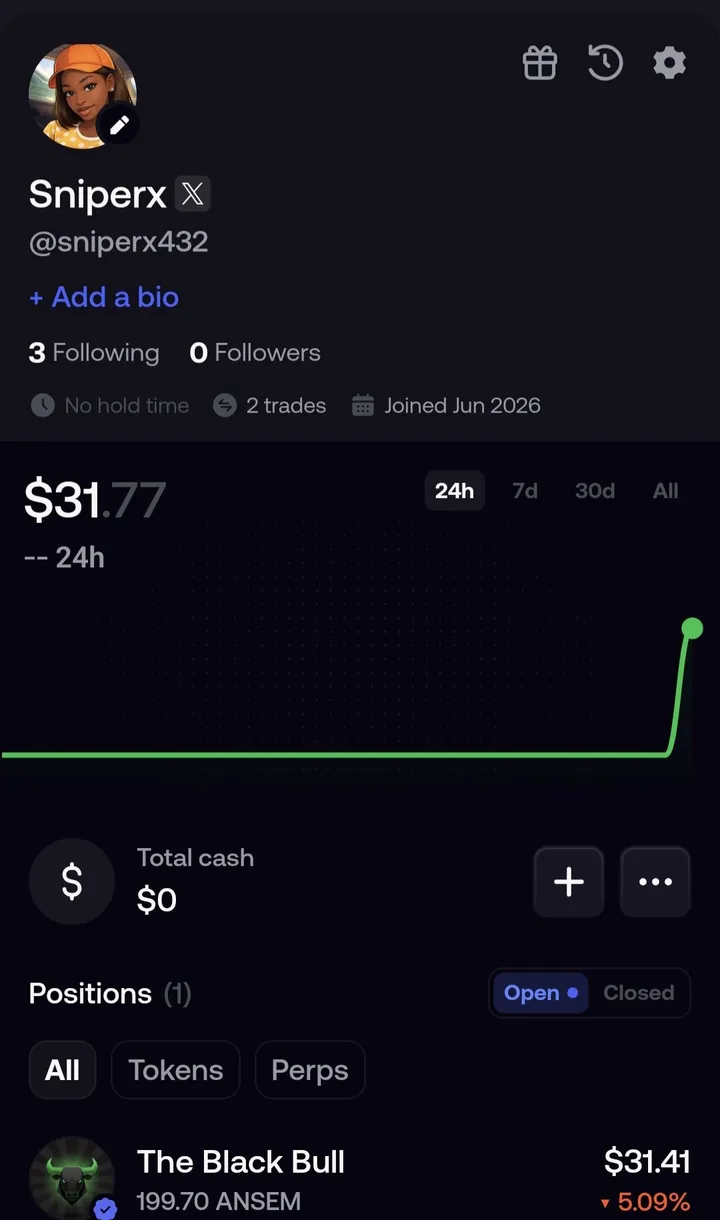
Chart vs PnL, side by side
| What happened | Profile chart | PnL figure |
|---|---|---|
| A token you hold rises 20% | Up | Up (unrealized) |
| You sell that token | About flat, minus fees | The gain becomes realized |
| You deposit $100 | Up $100 | No change |
| You withdraw $100 | Down $100 | No change |
| Tokens arrive from another wallet | Up by their value | Entry priced at the moment they arrived |
| You move cash into perps | Should stay the same | No change |
How to read your real performance
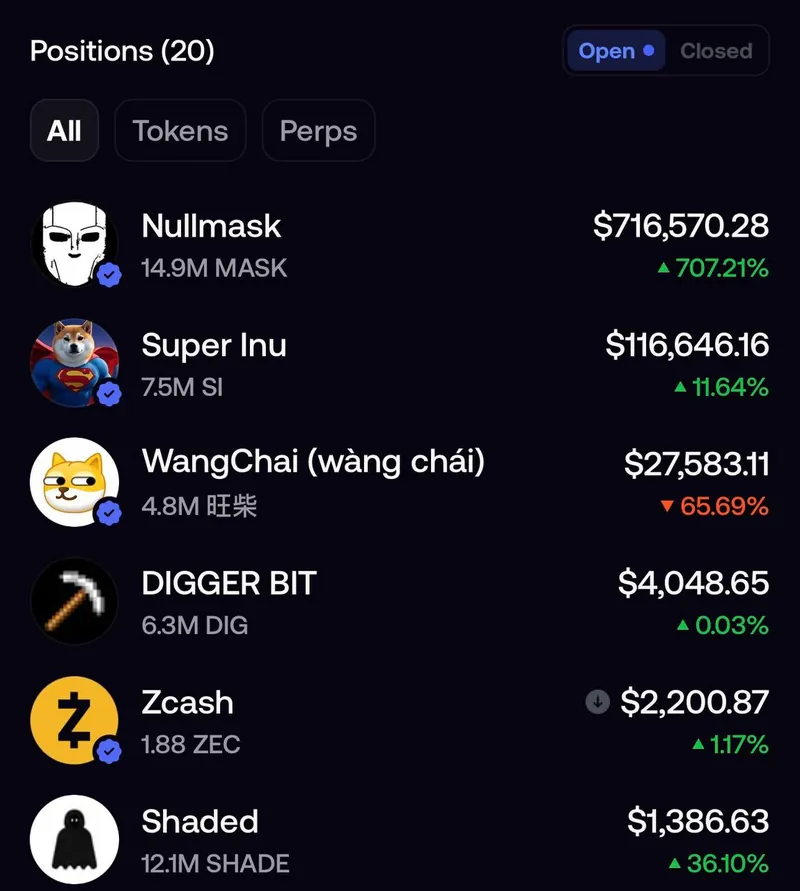
- Open the Portfolio tab and read the figure under your balance, not the balance itself.
- Tap All for your whole record, or 24h, 7d or 30d for a shorter window. The figure covers realized and unrealized PnL on tokens and perps.
- Switch your positions to Closed to see each finished trade with its date and realized PnL.
- For a cash check, tap the clock icon at the top of the Portfolio tab to open History. Filter by Cash for deposits and withdrawals, and by Transfers for sends.
- Do the sum: current balance, plus everything you withdrew, minus everything you deposited. Put in $500, took out $300 and now hold $400? You're $200 up.
The weak spot is step 5. Fomo has no PDF, CSV or statement export of your history, in the app or on the web, so you add up those entries yourself. The guide to Fomo transaction history shows where each entry lives.
When the chart still looks wrong
- It dropped and you didn't withdraw. Check the prices of what you hold first, then look in History for a send or withdrawal you forgot. If you find a transfer you didn't make, read what to do about a transaction you did not make.
- The PnL figure lags the chart. PnL refreshes about once a minute and sometimes only hourly, so a gap of up to an hour is normal.
- A position or your balance is missing. Start with balance or positions not showing.
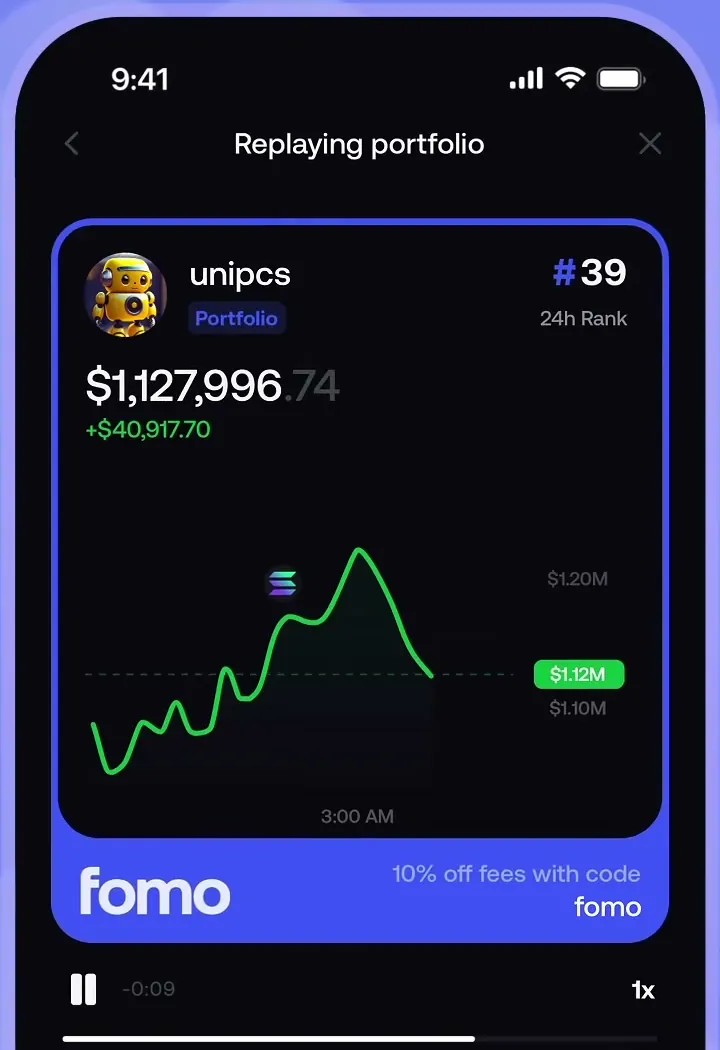
Share cards follow the same split. A Portfolio card shows your account value, the number the chart tracks. To show how a trade went, share the position card, which carries that trade's PnL.
Common questions
Is a drop after a withdrawal a loss?
No. The money moved to your bank or another wallet. Your PnL figure isn't affected by it.
Why didn't my chart rise when a token I sold pumped?
After the sell, that money sat in cash, and cash doesn't move with token prices.
Does moving cash to perps lower the chart?
It shouldn't. Perps account equity is part of the total the chart draws.
Related: how to read your PnL on Fomo and how to withdraw from Fomo.
 Written by Mohammad ShahpariCrypto and SEO specialist
Did this answer your question?
Thanks for the feedback.