How to Read Your PnL on Fomo
Fomo shows PnL under your balance for 24h, 7d, 30d or All, plus on every position. See what counts, how fees and transfers move it, and why cards differ.

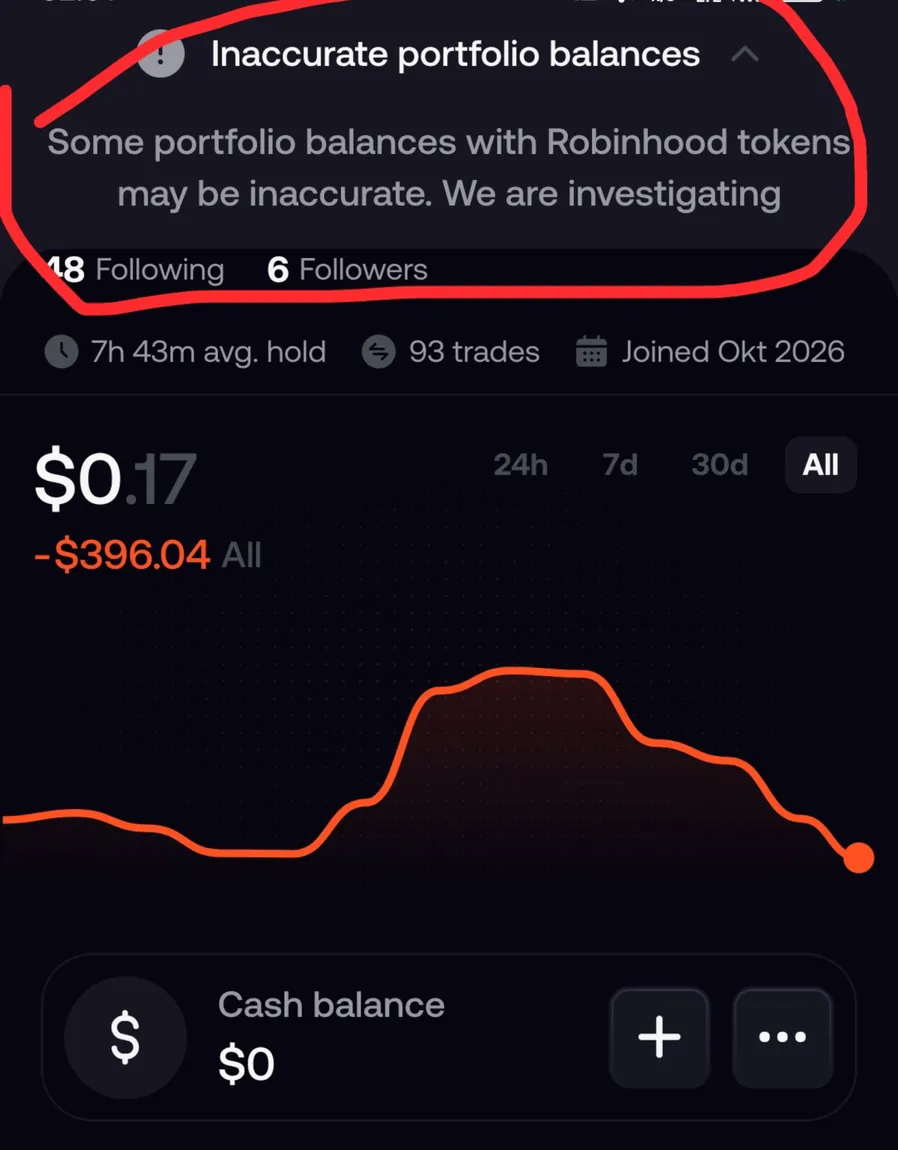
Your PnL on Fomo is the green or red figure right under your balance on the Portfolio tab. Tap 24h, 7d, 30d or All to change the range. The figure covers realized and unrealized PnL on tokens and perps for that window. Each position also has its own number: an open position shows your total return on that token, and the Closed tab lists the realized PnL of every finished trade.
The big dollar amount above that figure, and the chart under it, are something else. That is your portfolio value, and it moves with deposits and withdrawals. Below is what goes into each number and why they rarely match.
Where Fomo shows PnL
| Where you look | What the number is |
|---|---|
| Under your balance on the Portfolio tab | PnL for the range you picked, realized plus unrealized, tokens and perps together |
| The balance and the chart | Portfolio value: cash, holdings at market price and perps account equity. Not PnL |
| An open position | Total return on that position, including any part you already sold |
| The Closed tab | Realized PnL of each completed trade, with its date |
| A share card | One position, as it stood on the day you made the card |
Realized vs unrealized PnL
Unrealized PnL is the paper result on tokens you still hold. It changes with every price move, which is why the percentage on an open position never sits still. If you sold part of a position, the figure blends both halves: the current value of what you still hold plus what you already got back.
Realized PnL is locked in when you sell. Fomo works it out from what you actually received, at the price the trade executed on chain, which can differ from the quote you saw a moment earlier. On thin, fast-moving tokens the gap can be large, so a sell can close lower than the screen suggested.
Perps follow their own rule. The PnL on a closed perps position includes funding but leaves out trading fees. Add up your closed perps trades and you get more than the change in your perps cash balance; the difference is the fees.
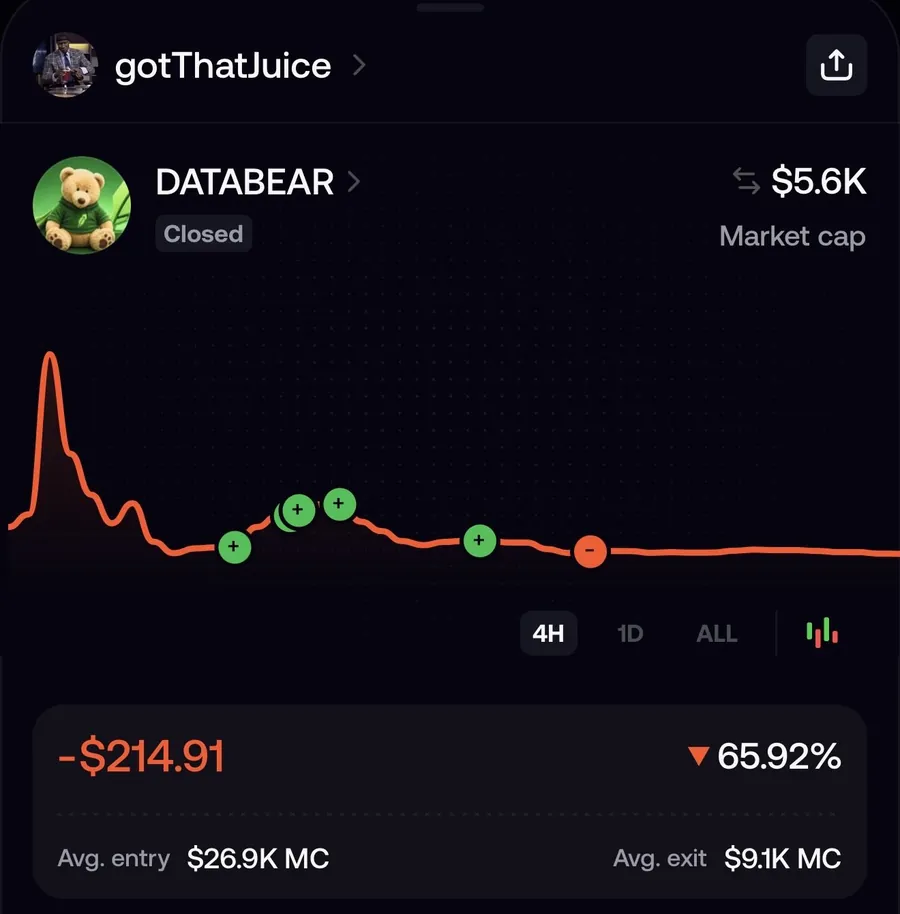
To check a single trade, tap the position. The details show your average entry, how much you bought, what you paid and what you received when you sold.
How fees, deposits and transfers change the number
- Fees. PnL is built from what you paid and what you received, so fees are already inside it. Outside Solana you also pay the network fee, and on Ethereum that can be a big share of a small trade.
- Deposits and withdrawals. Adding cash raises your balance and the chart, but a deposit isn't a trade, so it isn't profit. A withdrawal isn't a loss either. The guide on why the profile chart drops after a withdrawal goes through this.
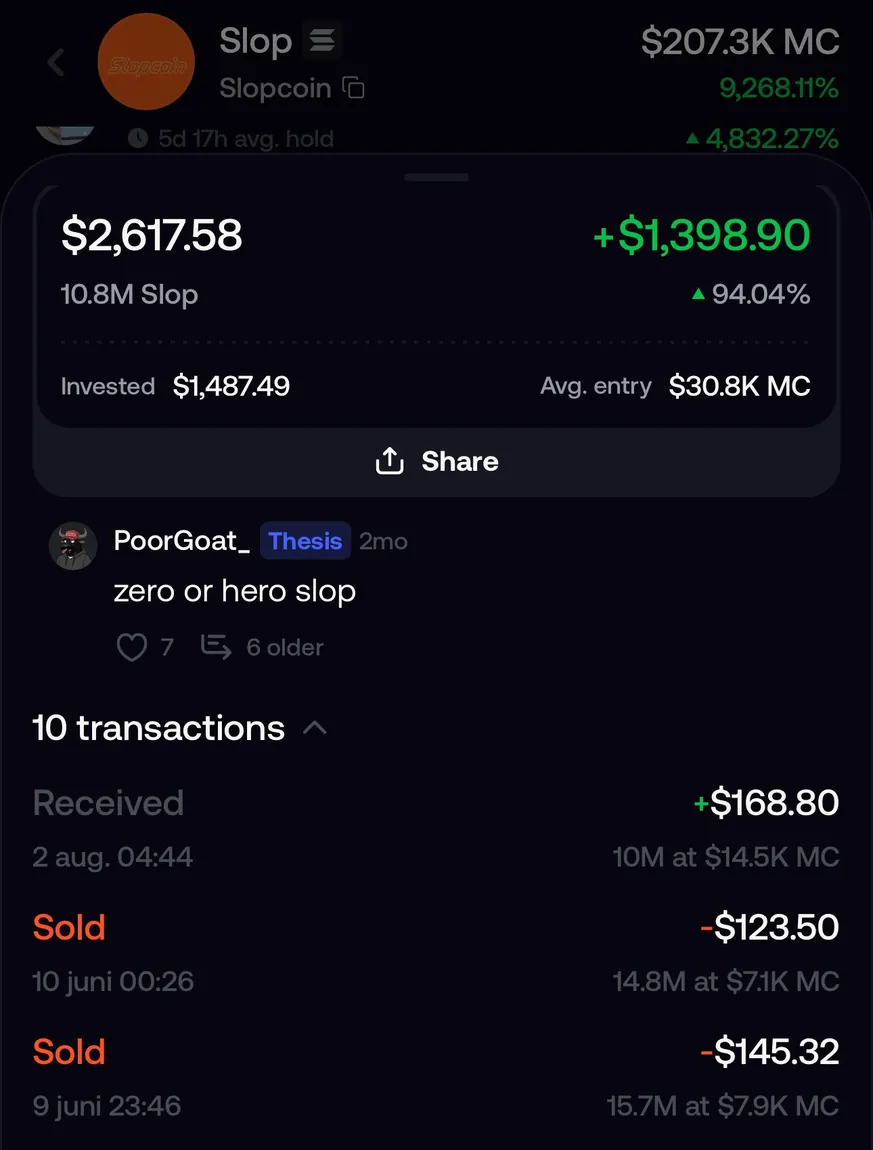
- Tokens sent in from another wallet. A position marked Received from external wallet gets its entry price and PnL estimated from the token's price when it arrived. In the screenshot below, 10M tokens received at a $14.5K market cap added exactly $168.80 to the Invested figure.
What 24h, 7d, 30d and All mean
The range buttons sit at the top right of the chart. Tapping one changes both the window the chart draws and the PnL figure under your balance. 24h is the last day; All covers the life of the account.
So a +$500 All figure next to a red 24h figure is normal. You're up overall and had a bad day. The leaderboard uses the same windows, which is why your rank on 24h can look nothing like your rank on All.
Why a share card shows a different number than your profile
A position share card covers one token. The figure on your profile covers every token and perp for the range you picked. They only match if you held a single position for exactly that window. Other reasons they drift apart:
- A card is a snapshot with a date on it. The profile keeps updating, roughly once a minute.
- The share sheet has checkboxes for Notional pnl, Buy/sell markers and Referral code, so one trade can produce cards that look different. Some cards show only the percentage.
- Bought at, Avg. entry and Current on a card are market caps, not token prices. A token that went from a $14.3K to a $12K market cap is down about 16%, which is what the card below shows.
- A Portfolio card shows your account value, the same kind of number as the big balance on your profile.
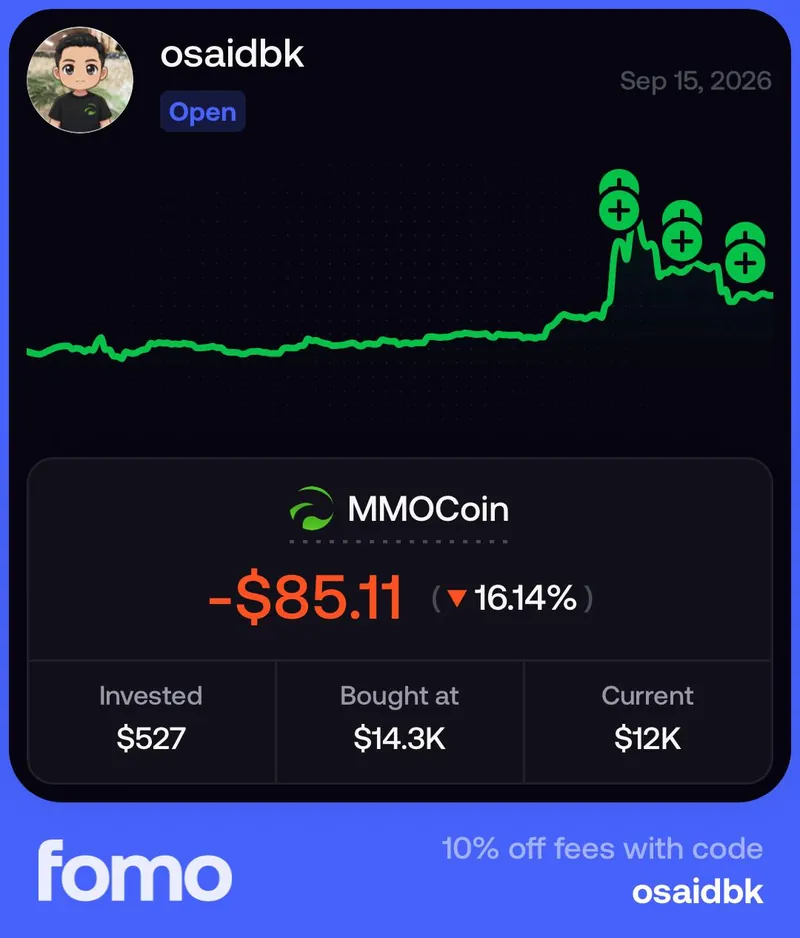
Making them is covered in how PnL share cards and replay cards work.
When the number looks wrong
- It lags your balance. PnL refreshes about once a minute, and in some cases only hourly. A figure that trails your balance for up to an hour is expected, so give it time before you contact support.
- A sell came back lower than the quote. Realized PnL uses the execution price. See why a trade fills at a different price than the quote.
- Every dollar figure shows asterisks. Your balances are hidden. Tap the balance at the top of the screen to show it again. On the web, open the menu under your profile picture and turn off Blur balances.
- Fomo flags a problem itself. In October 2026 a banner on the profile warned that some balances with Robinhood tokens might be inaccurate (first screenshot). While a banner like that is up, treat the numbers on those positions with caution.
One limitation to know: Fomo has no PDF, CSV or statement export of your history, in the app or on the web, so you can't pull a statement to check the maths against.
Common questions
Does my PnL include perps?
Yes. The figure under your balance covers realized and unrealized PnL on tokens and perps together.
Do deposits count as profit?
No. A deposit raises your balance and the chart, but PnL only counts the results of your trades.
How often does PnL update?
About once a minute. Sometimes it refreshes hourly instead, which is not a fault.
Related: how to sell a token on Fomo and finding your transaction history.
 Written by Mohammad ShahpariCrypto and SEO specialist
Did this answer your question?
Thanks for the feedback.